Scalene
Scalene is a modern Python profiler that supports a wide range of profiling styles. It provides both a command line interface and a web-based GUI for visualising results. Unlike many other Python profilers it uses a sampling approach to minimise the profiling overhead, making it suitable for profiling expensive use-cases. It has support for AI powered optimisation suggestions, however this requires running a local LLM or having an API key for a cloud LLM platform.
QuickStart
1. Scalene can be installed via pip or conda.
# install via pip (may not work on MacOS)
pip install scalene
# or
# install via conda
conda install conda-forge::scalene
2. Optionally, decorate specific functions to profile with @profile. This is likely unnecessary for most projects, but may be of use if you target a very expensive function after an initial profile.
This does not need to be imported.
@profile
def my_function():
    print("do something")
3. Run the Python code via scalene.
If you would normally execute your script as
python my_script.py 1087
You can call scalene with the below, including any required runtime arguments as normal.
python -m scalene my_script.py 1087
Interpreting Output
At exit, an interactive page with the profiling results will open in your web browser. Files profile.html and profile.json are also output to the working directory, which can be saved to reopen or share the profiling results.
The profiling results are broken into several sections.
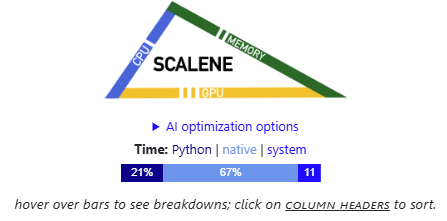
At the top of the page, a blue bar is shown, which shows the proportion of the overall runtime that was sampled in Python, Native and System execution. Hovering over the sections of the bar provides a tooltip showing the absolute time.
Below this, there is a list of each of the source Python files touched during the profile, these can be minimised with the triangle button (▼). Each file contains both a line-level and function-level profile.
The line-level profile is displayed first, by default this only displays lines which were caught in the profilers samples, as such the majority of lines of code may not be displayed (including some class names!).
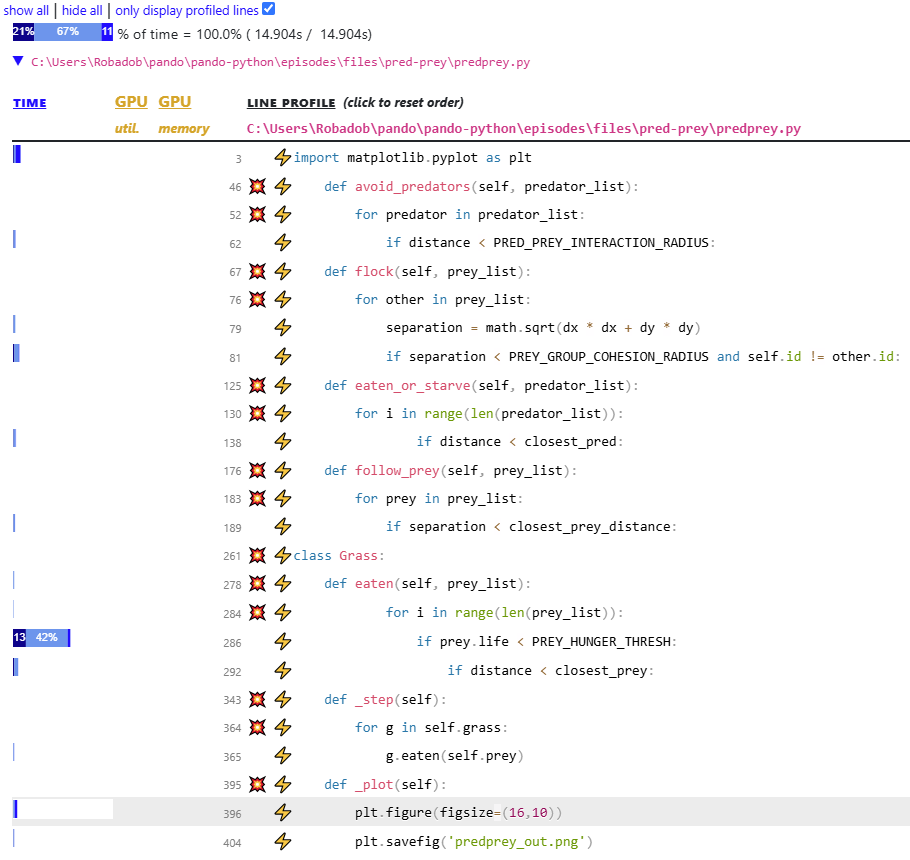
In the above line-level report, it is clear that over 50% of the code’s runtime is occupied by predprey.py:286.
The function-level results for the file, are below the line-level results.
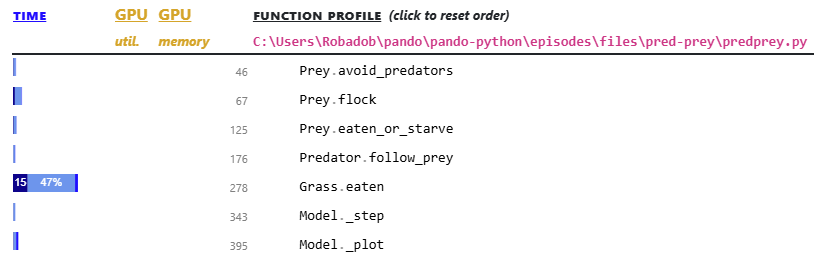
Here it is clear that 65% of the runtime is spent within the Grass.eaten() function which can be found at line 278. This is the function that includes the most expensive line identified in the line profiler.
Perhaps not clear from these results, Grass.eaten() was called 1.25 million times during the profile!
Limitations
As a sampling profiler, with a relatively low sample rate, Scalene may provide inconclusive profiling results for small inexpensive codebases. A deterministic profiler such as cProfile or line_profiler will capture every function/line executed.
When hovering time bars in the line/function profile, some of the less expensive lines/functions may have bars of 0 pixel width, which prevents their time from being visualised. If scale is instead executed with the --cli flag (which requires an ANSI colour capable terminal), it will be printed as a table to the command line interface which may be clearer.
If you aren’t getting enough detail in your results, you may wish to try decreasing --cpu-sampling-rate <value> (defaults 0.01s) or --malloc-threshold (defaults 100), to increase how much information is captured. This will cause profiling to take longer.
In the above example we were unable to get CPU memory profiling to display, even after passing --malloc-threshold 1. It may only capture significant memory allocations, and should be displayed as an additional column during the line-level results table.