VizTracer
VizTracer is a simple Python package for timeline profiling. It’s profiling output can be visualised in a web browser with it’s sub-package VizViewer.
QuickStart
1. viztracer can be installed via pip or conda.
# install via pip (may not work on MacOS)
pip install viztracer
# or
# install via conda
conda install conda-forge::viztracer
2. Run the Python code via viztracer.
If you would normally execute your script as
python my_script.py 100
You can call viztracer with the below, including any required runtime arguments as normal.
python -m viztracer my_script.py 100
3. Visualise the output.
On success VizTracer will output a file result.json to the working directory. This can then be visualised with vizviewer.
python -m vizviewer result.json
This should then open vizviewer in your web browser.
Interpreting Output
VizViewer provides an interactive visualisation of the timeline, that can be panned and zoomed to investigate the call-stack throughout the program’s execution.
You can pan the timeline by holding Shift and dragging, or by pressing A and D on your keyboard. To zoom, hold Ctrl and scroll with your mouse wheel, or use W and S.
You can also pan and zoom using the bar located just below the ruler at the top of the screen. At first, the bar appears white with grey handles on both ends. Drag the handles inward (no Shift required) to zoom into part of the timeline. To pan, drag the white section itself, or click and drag within the grey area to create a new zoom range.
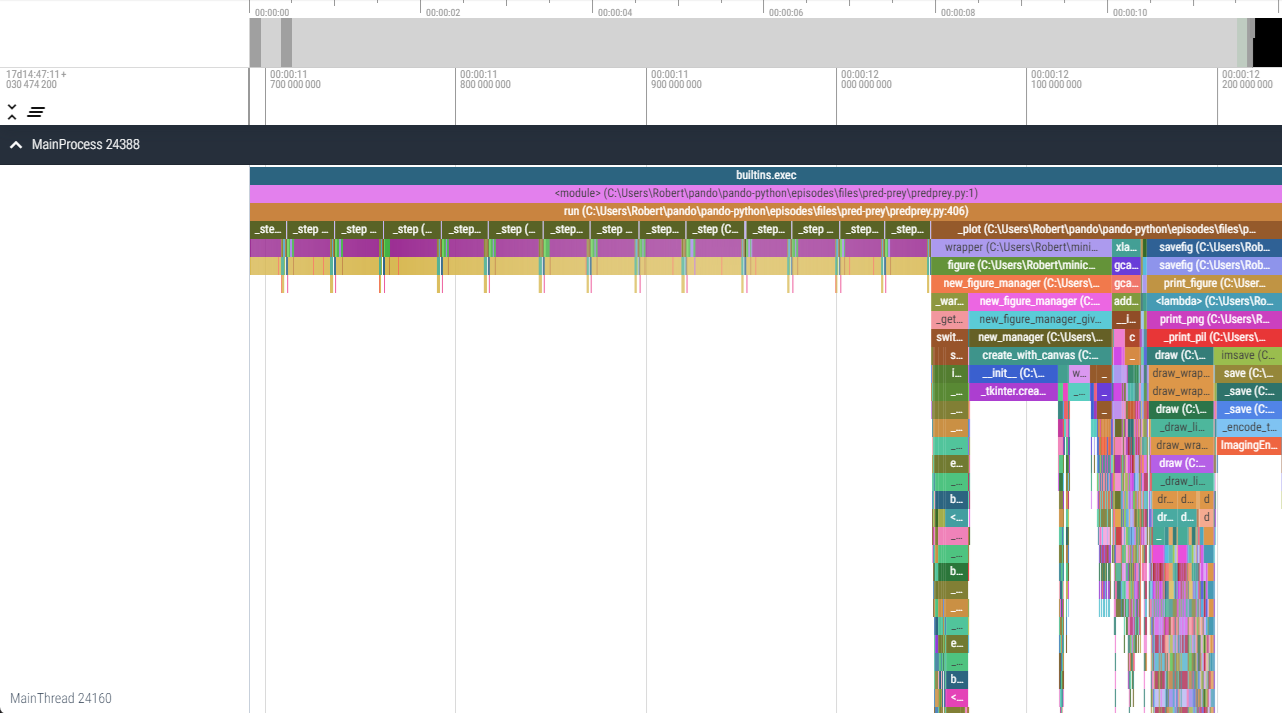
Within the above example, the profile demonstrates iterative steps of a model on the left-hand side of the timeline followed by generation/export of a plot of the results on the right-hand side where the pattern changes.
The “icicles” on the right-hand side mostly show child function calls within the library MatPlotLib. They are much “taller” because there are significantly more nested function calls than in the code that is part of the model.
Based on their width, it can be seen that each step has roughly the same runtime (e.g. they don’t get faster/slower over time), with most of the step time occupied by 1 sub-function (shown in purple/yellow). Zooming into the time-line would expose the name of this function. Likewise, plotting the results takes the same time as 6-7 steps, but most of that time is taken up by expensive MatPlotLib function calls.
Jupyter Notebooks
If you’re more familiar with writing Python inside Jupyter notebooks you can use VizTracer directly from inside notebooks.
1. Install viztracer and load it’s extension.
!pip install viztracer
%load_ext viztracer
2. Create and fill a viztracer magic cell
%%viztracer

# Your code here
After the cell has been executed, a “Show VizTracer Report” button will appear, if clicked this will open the results with vizviewer (explaind above).
Limitations
As a timeline profiler it will collect information for every function call, to avoid running out of memory it uses a circular buffer, whereby it only holds (by default) the last 1 million function calls. If your profiled code runs for a very long time, you may lose profiling information from the start of execution.
VizTracer is implemented in Python, so its performance may suffer (unconfirmed) when profiling complex code with many function calls.