Intel VTune
Intel VTune Profiler is a fully-featured profiler that supports a broad range of languages. Users wishing to perform function or line level profiling can use the default “Hotspots” configuration, that will output profiling results in an interactive GUI with several visualisation options to aide interpretation of CPU time within the profiled application.
There are also many more advanced profiling configurations available, covering memory and hardware metrics, these are unlikely to be useful for the typical programmer.
Refer to the Python section below to learn about profiling Python with Intel VTune.
QuickStart (GUI)
1. Install Intel VTune
Intel VTune profiler is freely available, it can be installed by following Intel’s installation guide. Be sure to select the latest profiler version.
2. Compile your program with both release optimisations and debug symbols.
If using a compiled language, in order for the profiler to include symbol information (so the profiler will list your functions by their names) your code needs to be compiled with debug information. However, you should also include release optimisations to ensure the profiled performance is representative.
If using CMake this could be as simple as using the pre-defined build configuration RelWithDebinfo, if the project is configured to support it.
# Re-configure in-source build as release optimised with debug symbols configuration
cmake .. -DCMAKE_BUILD_TYPE=RelWithDebinfo
# Rebuild the project with 4 threads
cmake --build . --parallel 4
If calling your compiler directly, you are likely to need to explicitly pass both -g for debug symbols and -O3 to maintain optimisations. These are common to most C/C++ compilers.
3. Profile your code
Open Intel VTune via your operating system’s start menu or ./vtune-gui.
By default it will show the welcome tab, click the large “Configure Analysis…” button, or select the configure analysis option (the icon) from the left-hand menu.
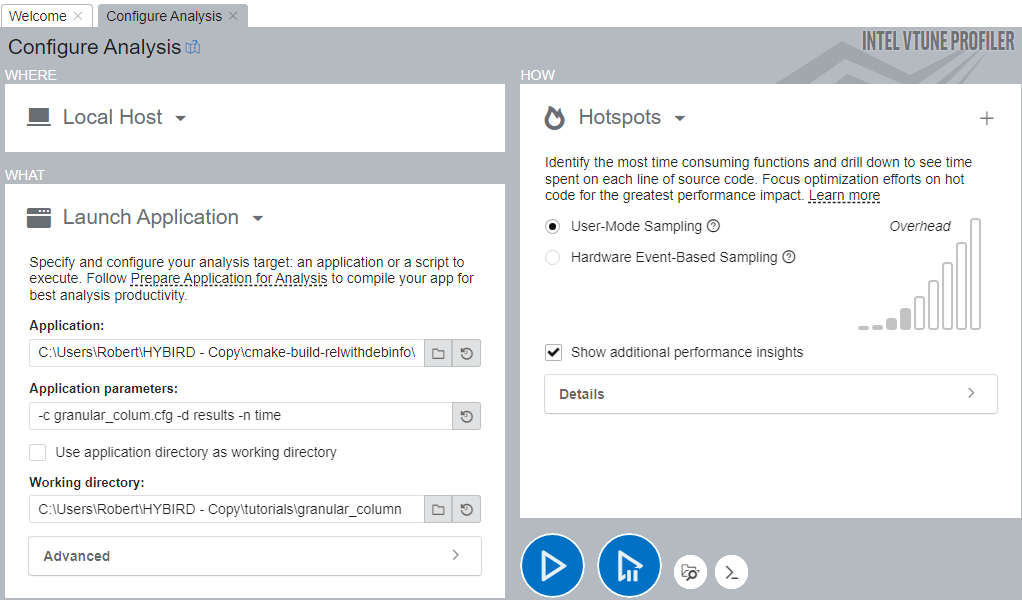
The default settings, shown above, to profile on the “Local Host”, via “Launch Application” with “Hotspots” profiling using “user-mode sampling” are sufficient for function-level and line-level profiling. You only need to complete the application field, by selecting the location to the program to be profiled. If necessary, you should also specify any parameters passed to the application (“application parameters”) and it’s “working directory”.
Once configured, you can click the start () to begin profiling. As shown below, Intel VTune displays the application’s output log and the elapsed execution time whilst collecting profiling data. The stop button () can be pressed, to exit the application early and display the currently collected profiling data.
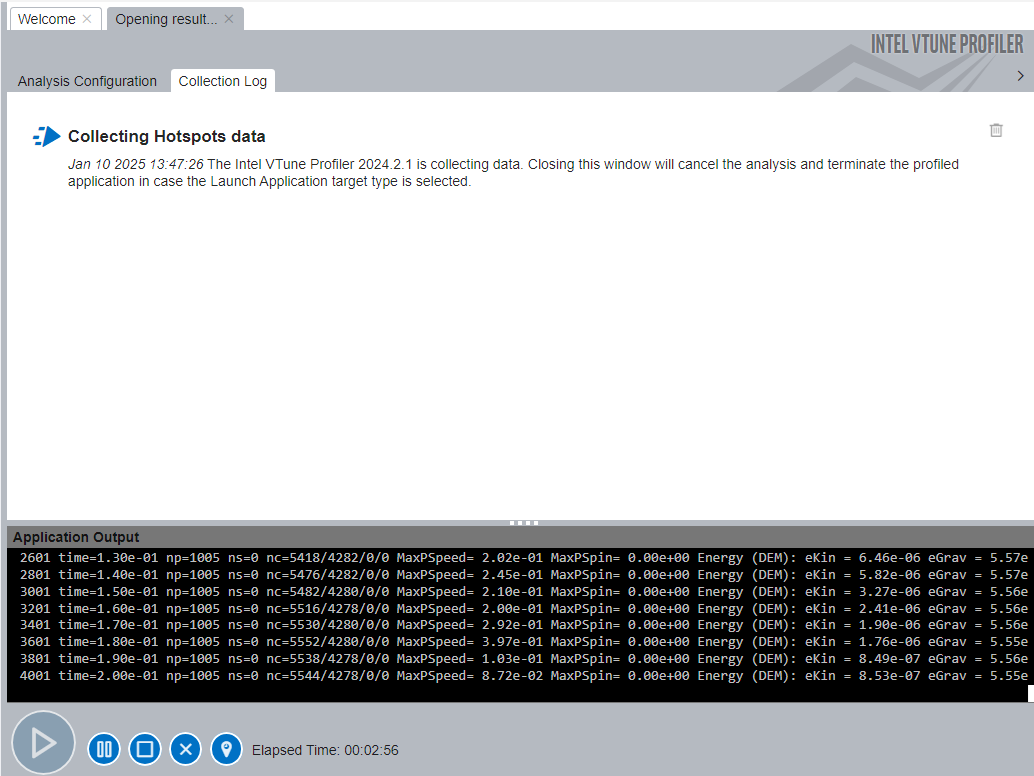
Once complete, the profiling results will be opened.
Interpreting Output
On opening hotspots profiling results the summary tab will be shown, with other tabs “Bottom-up”, “Caller/Callee”, “Top-down Tree” and “Flame Graph” which provide different visualisations of the function-level profiling results.
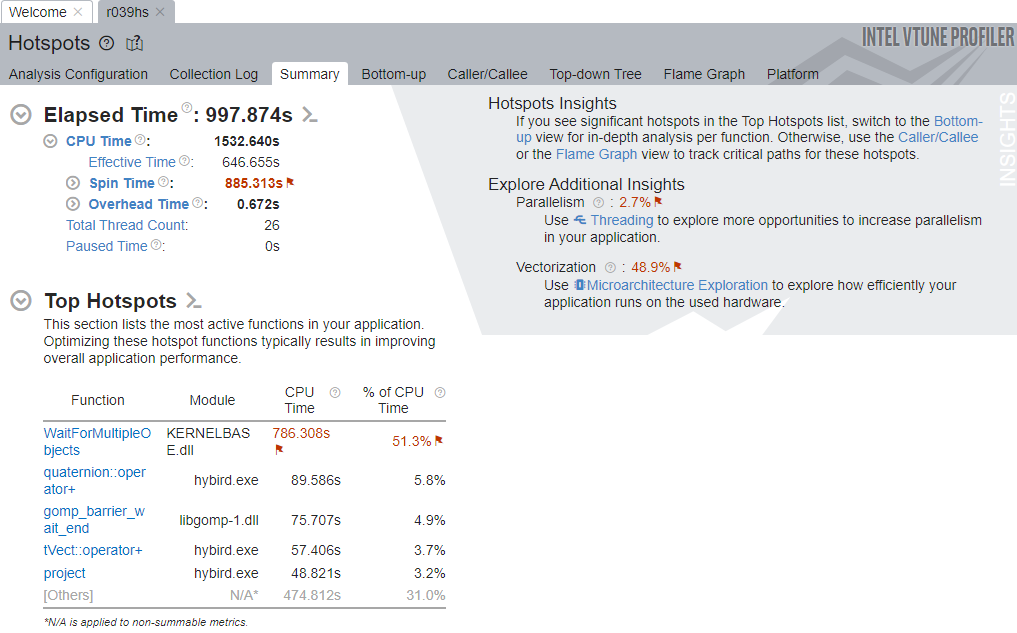
The hotspots profile summary shows some high-level information, most important of these is the “Top Hotspots” section which lists the functions that consumed the most runtime.
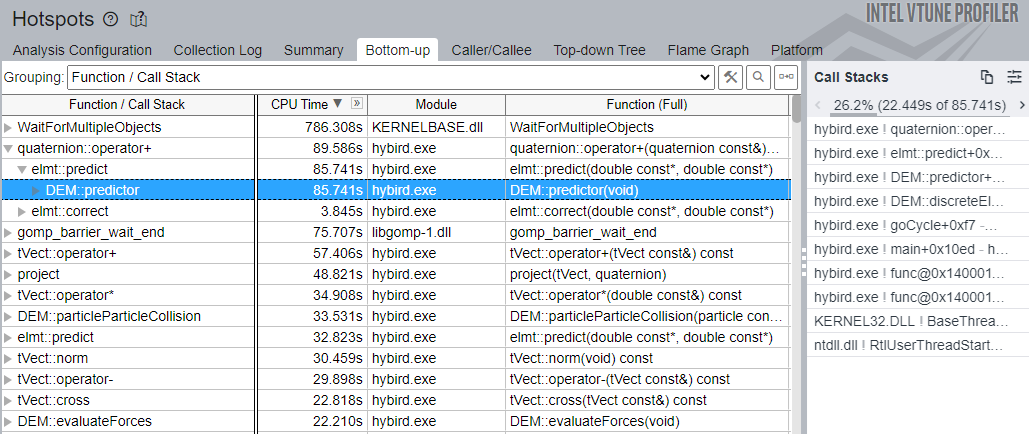
By default, the Bottom-up tab lists functions in order of CPU time (grouped by Function/Call Stack), they can then be expanded to show the call stacks in which they were called. This can be useful if an expensive function is called in multiple places, to identify the most expensive.
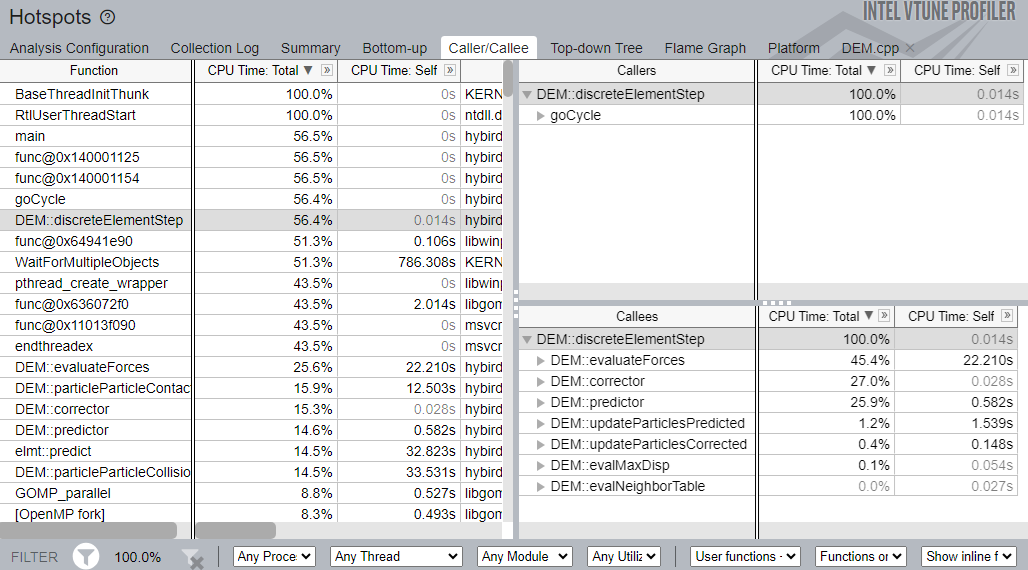
By default, the Caller/Callee tab lists functions in order of their total CPU time, inclusive of child function calls, displaying self CPU time (without child function calls) in the neighbouring column. When a function is selected, it’s callers and callees are displayed with their respective CPU times relative to the selected function’s CPU time in panels on the right-hand side.
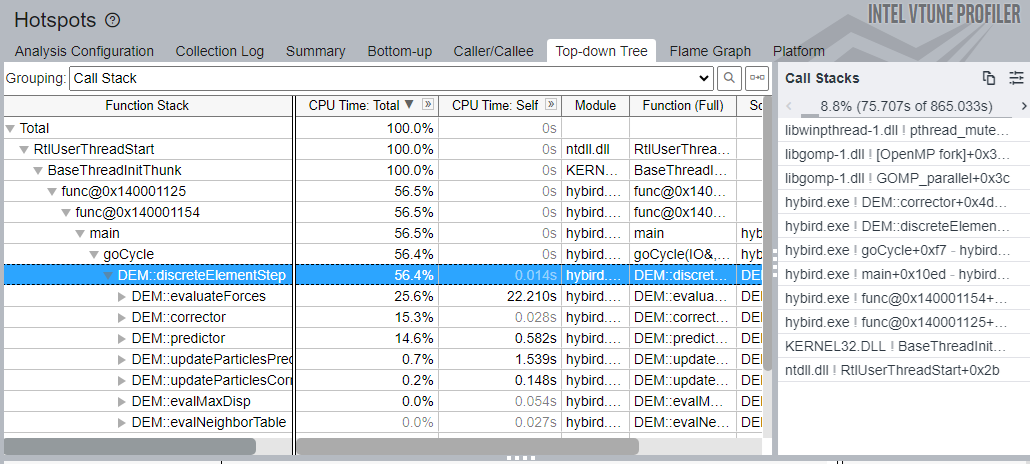
By default, the Top-down Tree tab provides an inverse to the Bottom-up tab, a tree starting from the root function call can be expanded to visualise paths through the call stack and respective CPU times.
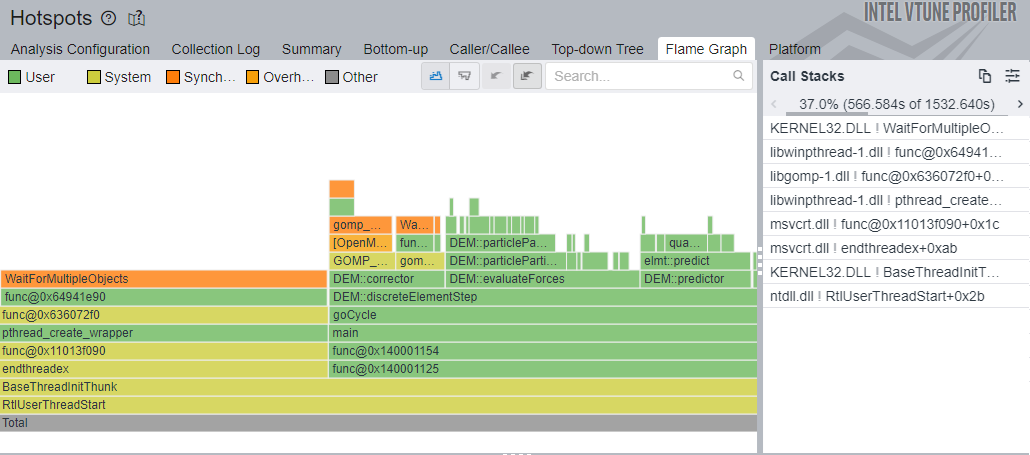
Finally, the Flame Graph tab provides an interactive visualisation to the Bottom-up results (it can be toggled to Icicle graph to display top-down results). The width of the graph represents the total CPU time of the application, each layer above this shows child function calls and with widths relative to their respective CPU times. Hovering a function’s box displays it’s information in a tooltip, and clicking one zoom’s the flame graph such that the selected function becomes the root with full width.
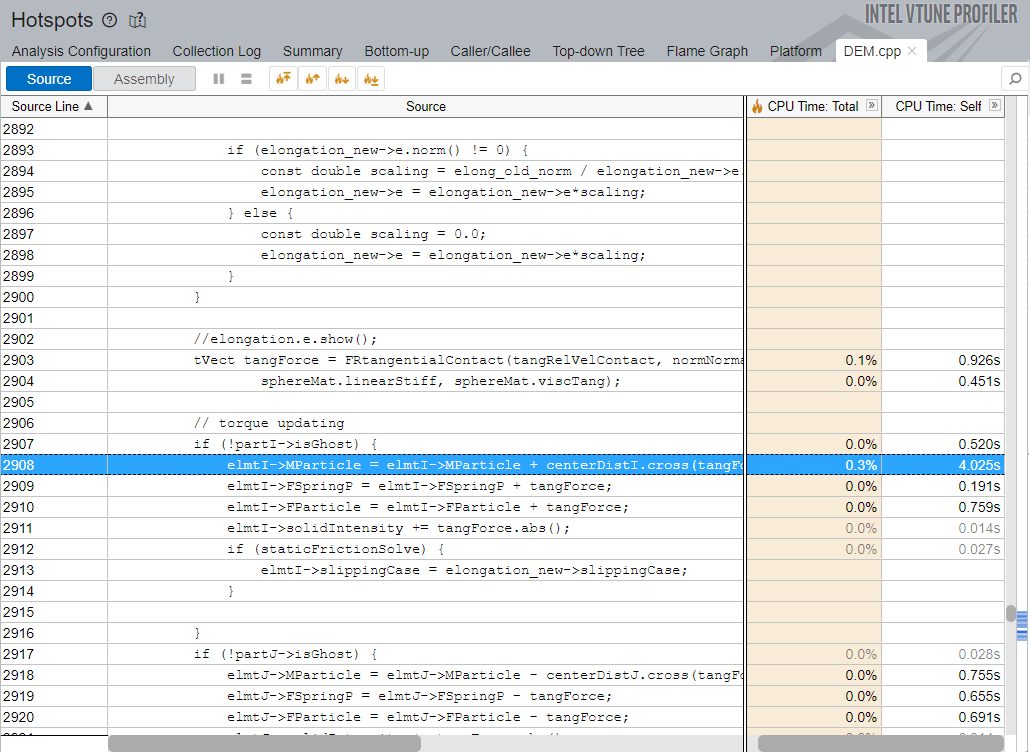
Line-level profile information can be accessed for functions, if the source file has not changed, by right clicking them and selecting “view source” from the context menu. This will open the relevant function’s source file, and focus the most expensive line of code.
Python
In order to profile your Python code with Intel VTune you must use the package pyitt (which can be installed via pip) and create tasks to be profiled within your Python code. For example
import pyitt

with pyitt.task('task_1'):
    # Do something as part of task 1
    # Do something else as part of task 1

with pyitt.task('task_2'):
    # Do something as part of task 2
Each task will then be displayed as a function within Intel VTune’s profiling results.
A complete guide can be found on Intel’s website.
Other Python profilers can operate with little to no changes to your Python code, you may prefer to use those over Intel VTune.
Limitations
Common to C/C++ profiling, you won’t be able to get profiling detail for any libraries used (including the standard library) unless you link against versions with debug symbols.
Intel VTune is a sampling profiler therefore only CPU time is reported by function-level profiling, it does not track how many times each function or line is called.
If profiling code that uses OpenMP, you will find many functions that you don’t recognise, some which are only displayed as addresses. These are functions inserted by OpenMP to parallelise your code. Try working with the flame graph visualisation to understand how they fit around the code you have written. You can control some of those functions appearing from the menus in the bottom of the vtune window

For many of the advanced profiling features of Intel VTune it requires administrator access and extra drivers to be installed. Likewise, some hardware metrics available in these advanced profiling modes are only available with a supported Intel CPU.